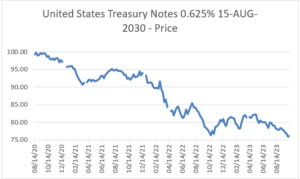
The academics need to go back to the drawing board. In just over three years, the security used to determine the so-called “risk-free rate” part of the formulas used to value stocks and the market in general has fallen 25% to 75 cents on the dollar. (It is the 10-year Treasury dating from mid 2020.) Holders of that security take little consolation that over the next seven years, it will “pull to par” and recover its full nominal value. Risk-free my foot!
Using the 10-year Treasury rate (along with the mystical & backward-looking ERP) as the basis for determining the cost of equity/expected future stock returns worked well during the 40-year period of declining interest and risk rates. Nice tailwind. With that paradigm now past, the question becomes, what will be the new framework for calculating discount rates/expected future returns? That topic is addressed in the upcoming Ownership Dividend.
(Guilty as charged in regard to the chart crime: I’ve top–ticked the start date and fiddled with the y-axis. Chart data: Factset)